
Epicycles |
Experiment with complex Fourier series


The Epicycles app is a tool for exploring the visualization of complex Fourier series. It allows users to interactively create and visualize epicycles based on sampled parametric curves or predefined Fourier series terms.
The app provides a visual representation of the complex Fourier series and demonstrates the approximation of complex-valued functions using epicycles. It can be used to study the properties of Fourier series, understand the concept of epicycles, and explore the visualization of complex functions in a fun and interactive way.

Experiment with complex Fourier series of the form:
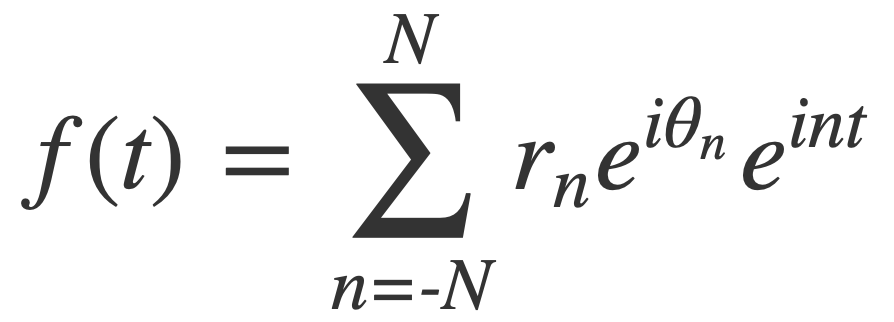
By Euler's Formula the nth term (or frequency component) of the Fourier series is a complex number that traces a circle with radius r(n) in the 2D plane n times as t traverses a period of length 2π. The summation traces the path of the function f(t) as t traverses a period of length 2π:
 |
 |
 |
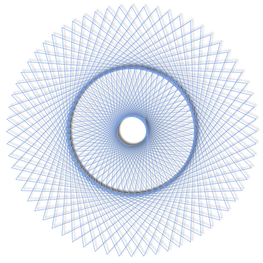
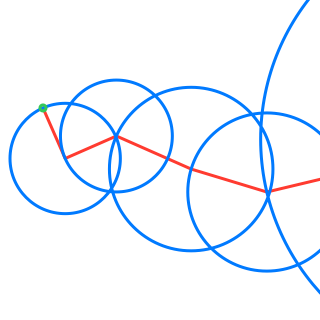
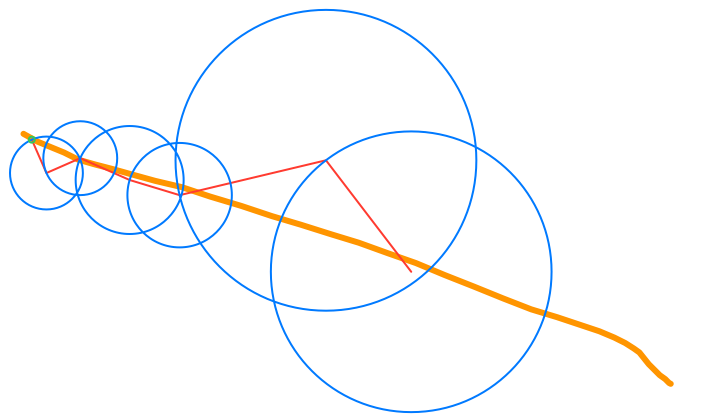
The circles in these animations that rotate on top of other circles are called epicycles. Each epicycle corresponds to a term of the complex Fourier series.
The partial sums of the Fourier series are used to draw the red line segment path in the animations, and also locate the centers of each blue epicycle circle. The radius of each epicycle circle is the magnitude of its corresponding Fourier series coefficient:
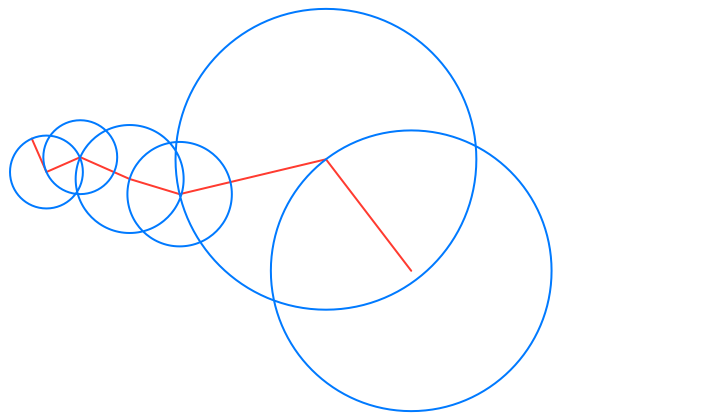
The origin of every red line segment path is determined by the constant term of the Fourier series, n = 0, and is fixed in time.
The end of every red line segment path is the value of the whole Fourier series, and is located at the green circle in the animations:
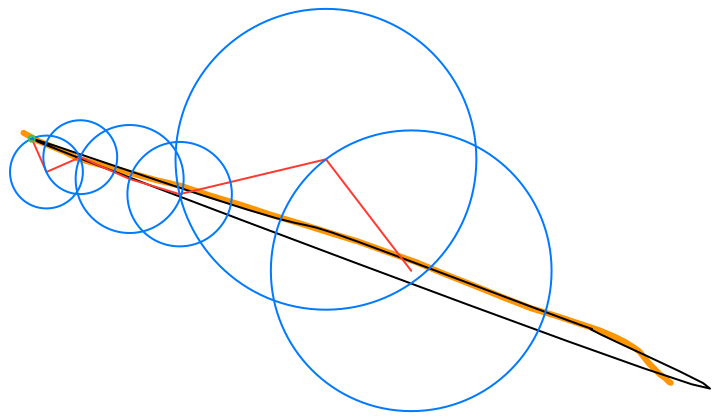
The green circle follows the approximating curve of the Fourier series, drawn in black over the orange curve of the function f(t):
Visualizes Fourier series of 2D functions parameterized by time that are built-in, your own drawn 2D curves, or custom frequency components using the terms editor.
Custom terms can saved by exporting them to 'epi' documents in Files, and then later restored by importing them.
Cyclic animations can be saved to GIFs or snapshots saved to PNGs in the Photos library, with sizes 480x480, 720x720 or 1080x1080.
The main view consists of several functional items: Graphic Menu, Time Slider (t), Number of Fourier series terms slider (N), Current Function Menu.
Graphic Menu:

In the main view use the menubar in the graphic view to select options to hide or show the following graphic elements of the Fourier series visualization:
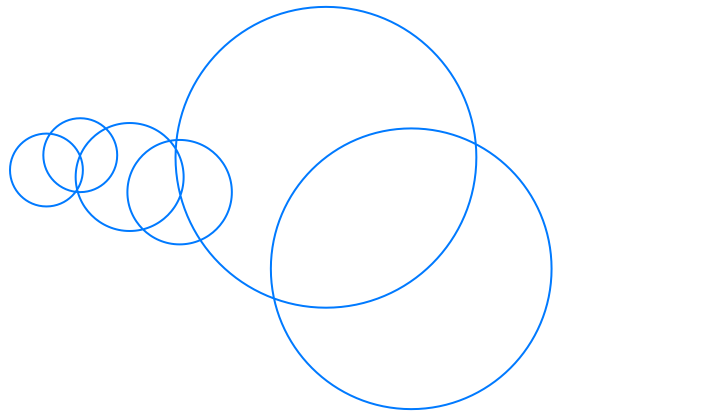
• Circle: The blue circles that are the paths traced by the epicycles. These illustrate Euler’s formula for the complex valued terms of the Fourier series, expressing each complex exponential term as a pair (r cos(n t), r sin(n t)) that trace a circle of radius r, n times as time t varies in the period of length 2π.

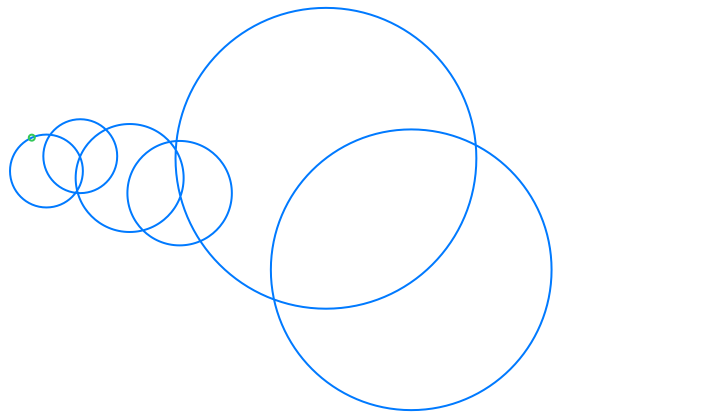
• Eye: The green circle that represents the value of the Fourier series at the current time.

• Lightning: The red line segment path that consists of the joined radii of the epicycles circles, from the origin to the value of the Fourier series at the current time.


• Pencil: The orange path that traces the current 2D function.

• Star: The black path that traces the Fourier series 2D approximation of the current 2D function.

Additionally in the menubar:
• Magnify: Hide some views to make room for the expanded display the graphic.

• Share: Save the graphic as an animated GIF or snapshot PNG in Photos library.

• Play: Animate the graphic by periodically advancing the current time.

• Info: Display internet resources conveniently in the app about Fourier series, epicycles and Euler’s formula.

Time Slider (t):
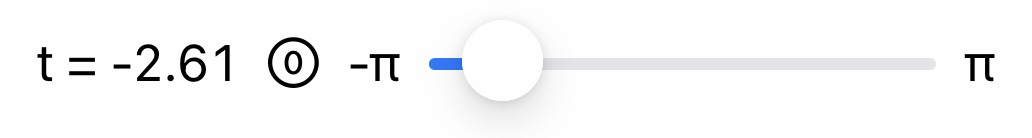
Adjust the time slider to see the state of all the graphic elements at any time within the time period [-π,π] on which the current 2D function is defined.
Number of Fourier series terms slider (N):
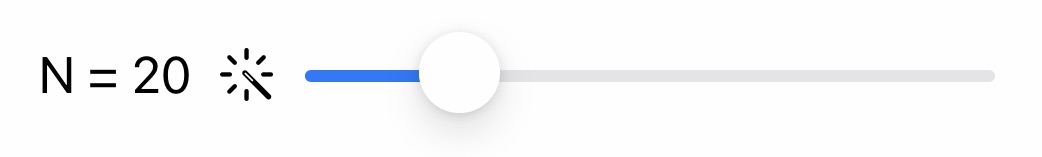
Adjust the number of terms included in the Fourier series approximation to the current 2D function. Frequency components in a partial Fourier series range from -N to N. The maximum value is limited to 100.
As a guide tap the wand icon to set the number of terms to a value whose corresponding highest frequency can theoretically be reproduced with the given number of samples, based on the concept of Nyquist frequency with uniform sampling. For the built-in sample functions that sample count is fixed. The number of samples of your own drawn curve is variable, and displayed in the drawing view.
The custom Fourier series using the term editor has known frequency components, limited to the range -20 to 20. The number of samples generated is sufficient for any selection in that range. Therefore in this case the wand sets N to the highest absolute frequency value of the terms.
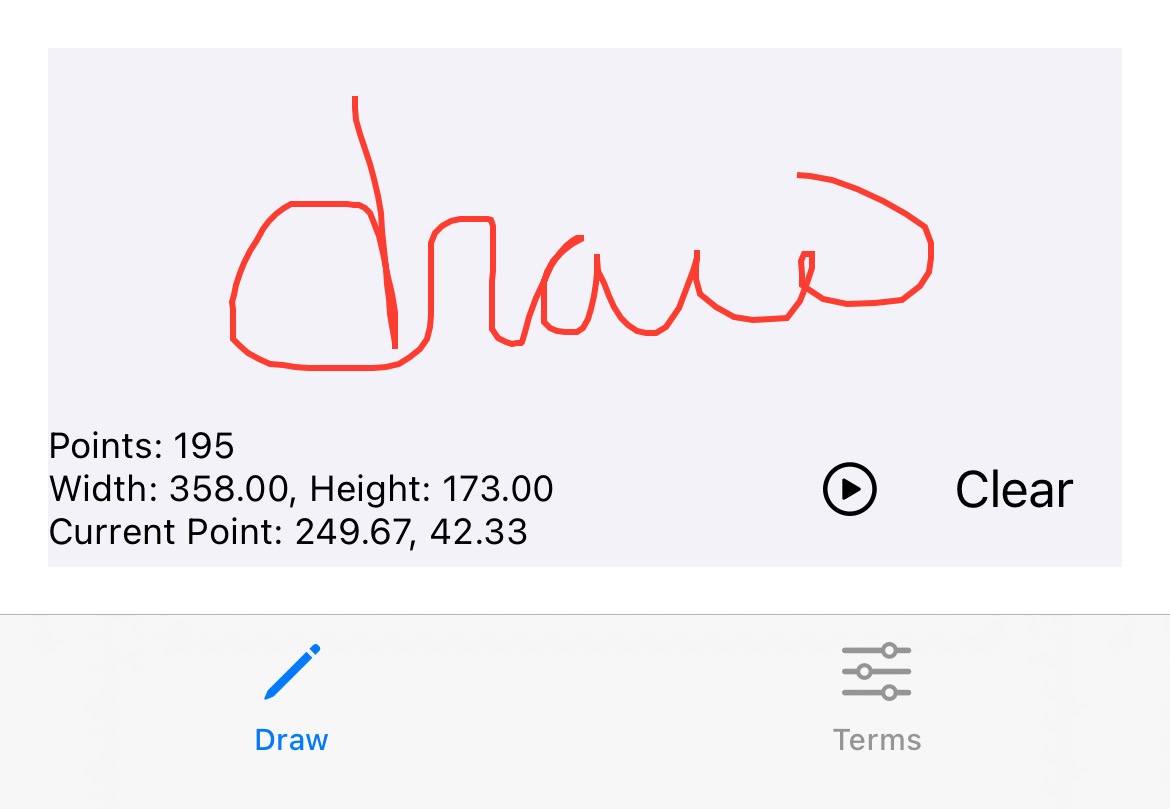
Current Function Menu:

Use the segmented control to select from a variety of built-in 2D parametric curves or select the `?` item. Then you can either draw a 2D curve in the Draw tab view, or edit custom Fourier series terms in the Term tab view. In the latter case the app will numerically generate the Fourier series of a Fourier series, by sampling the summation of the series terms.
 |
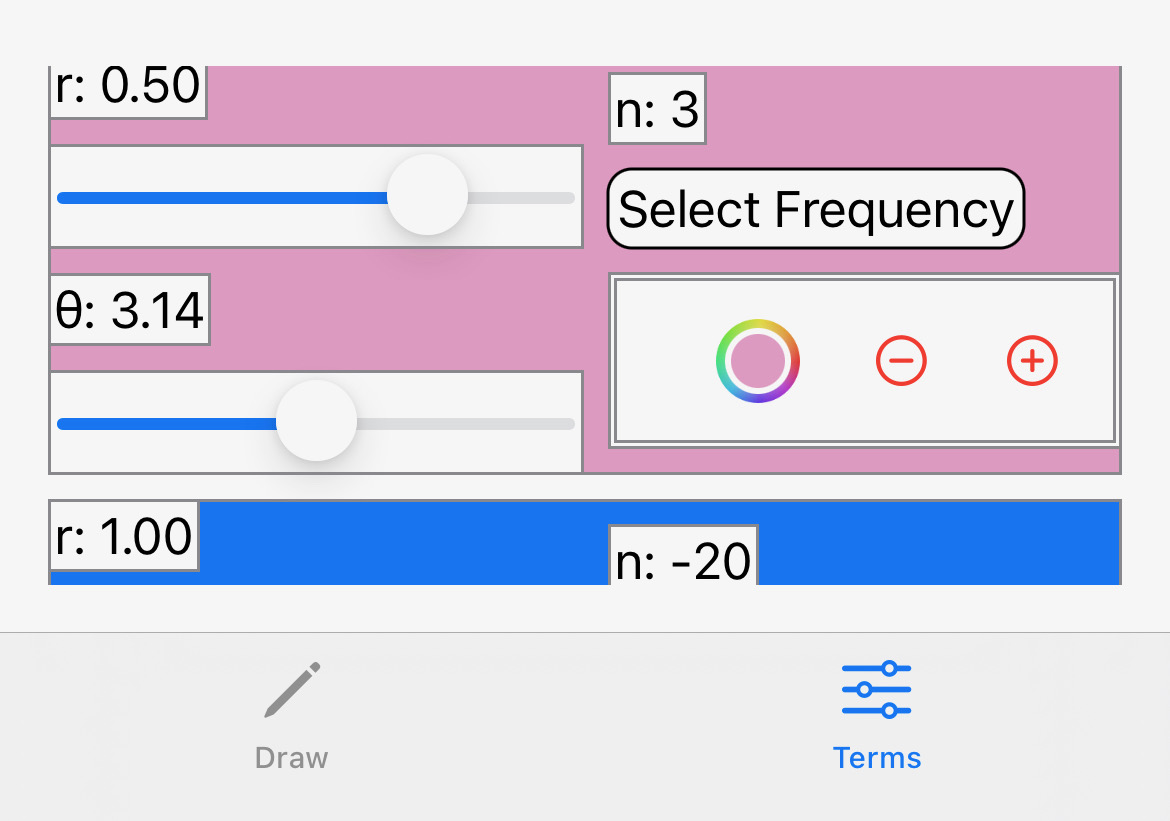 |
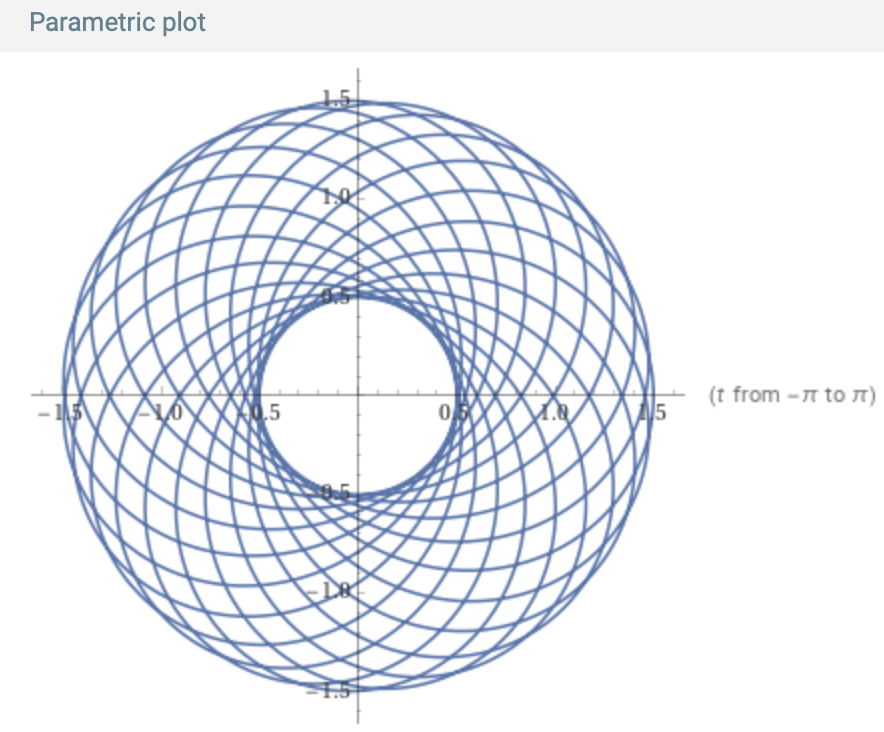
Donut Example
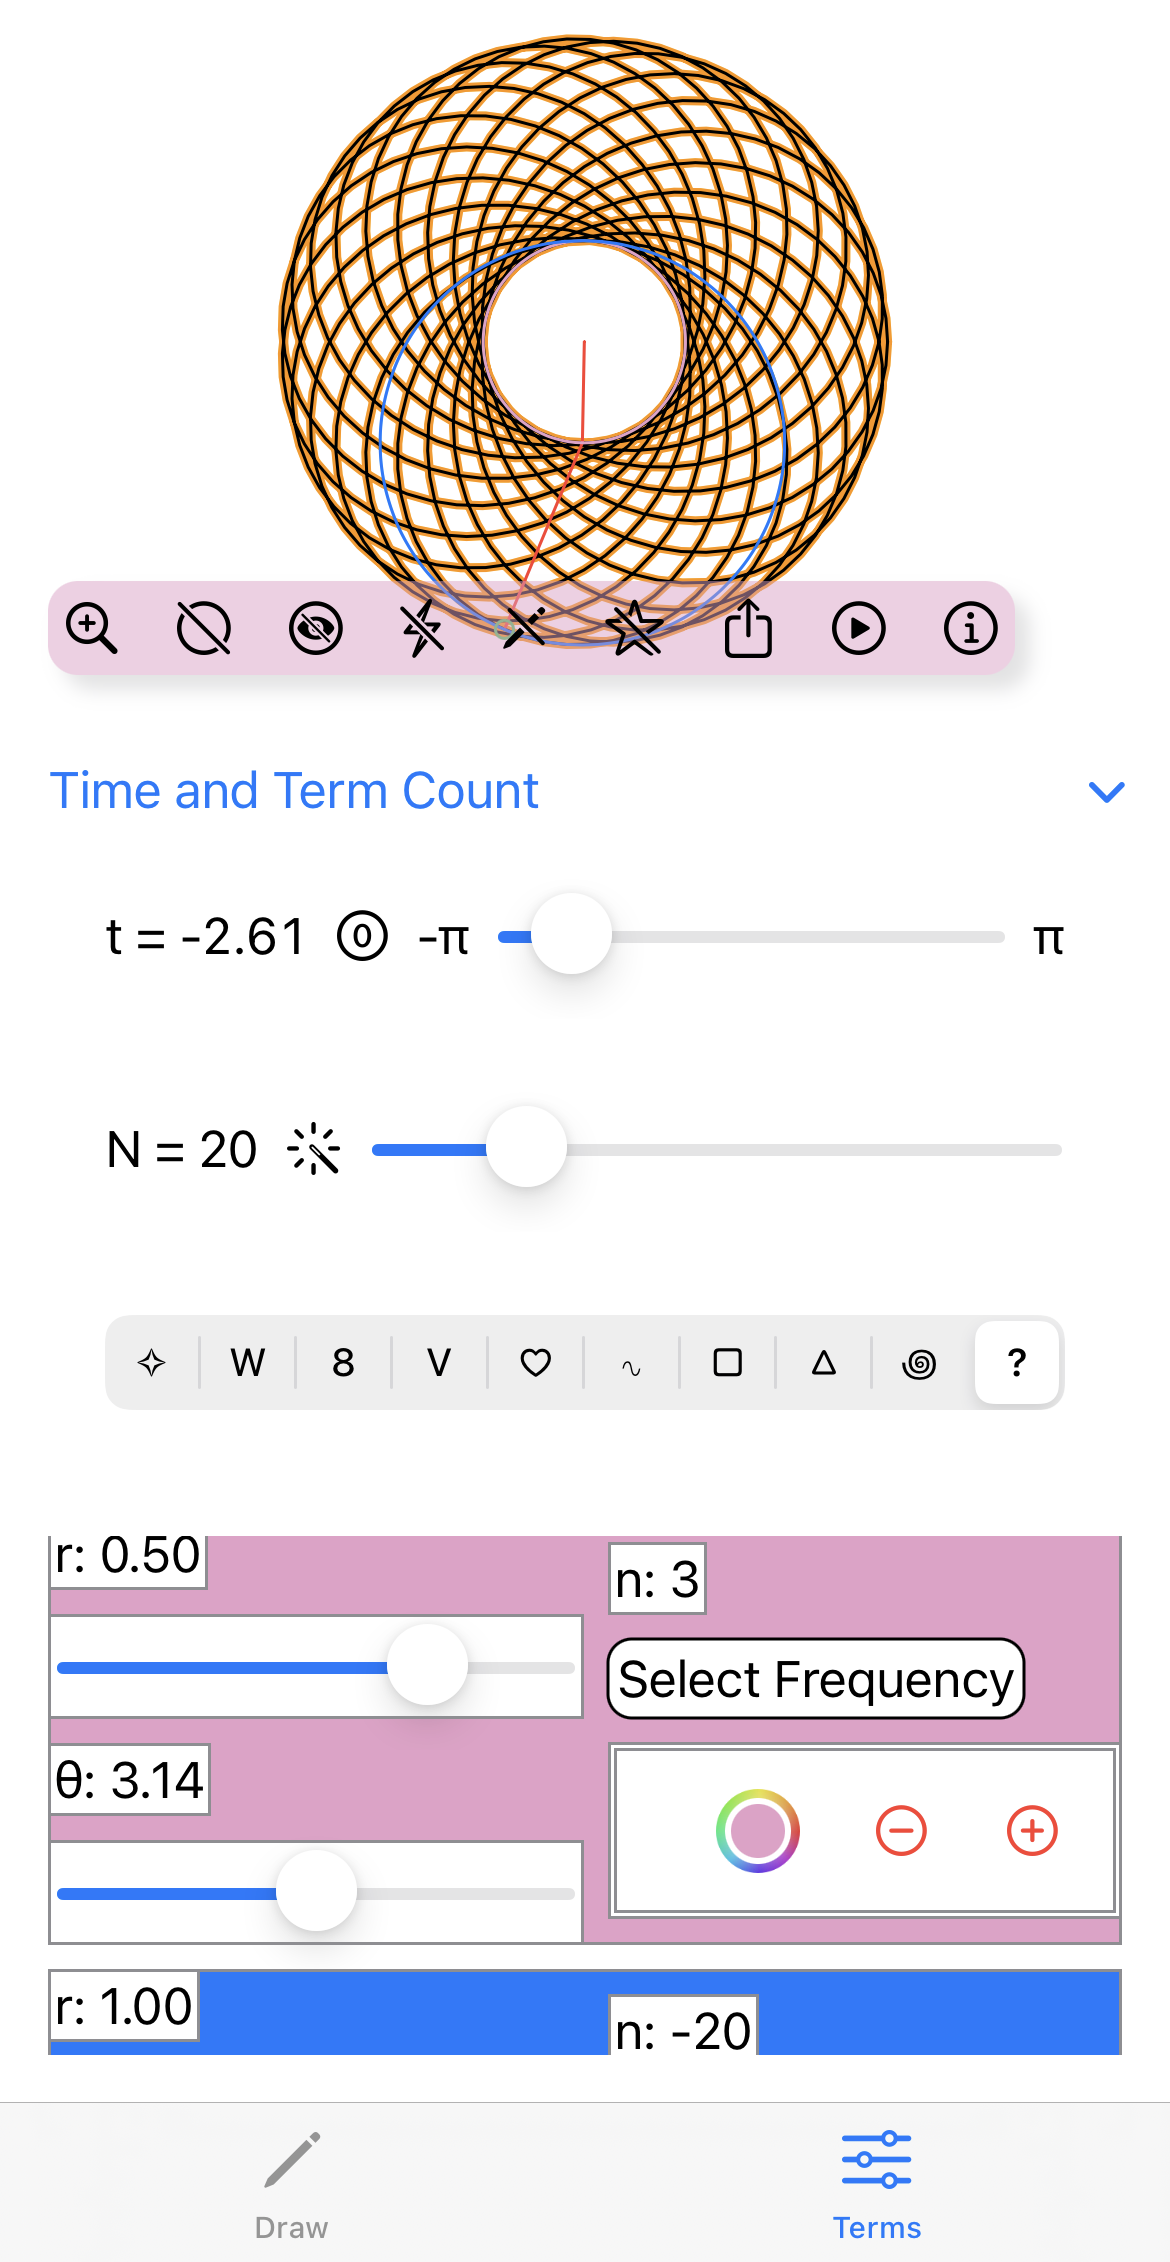
Consider the function the with following frequency components entered into the Epicycles app, recalling that π ~ 3.14:
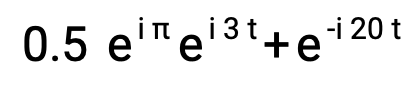
Expand this expression with Euler's formula:

Write in 2D parametric form, for t in [-π,π]:

And plot:
|
|
Free! |